Even the evaluation of the measuring results is uniquely simple with the ANALYSETTE 28 ImageSizer. The evaluation software ISS displays each recorded particle clearly as a data point in the immediately available FRITSCH Cloud as well as in the FRITSCH Gallery. You freely choose which statement is of interest to you: for example the Sphericity in regards to the Minimum Feret Diameter, the aspect ratio, applied on the porosity, or the convexity as a function of the particle Cross Section.
-
State-of-the-art evaluation with the ImageSizing-Software ISS
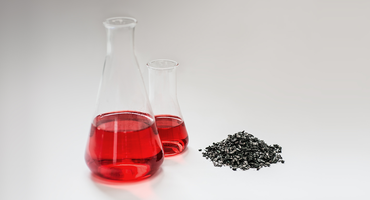
For all applications where besides the size also the shape affects the critical properties of a particle system, the ANALYSETTE 28 ImageSizer shows you fast and easily whether, for example, the grains of abrasives have sufficiently sharp edges, whether the particles of a plastic granulate are more spherical or oblong or whether the surface of an absorber is rather smooth or jagged. And because the complex shape of any particle cannot be described with a simple figure, the ImageSizing-Software ISS offers a comprehensive library of morphology parameters.
-
THE FRITSCH CLOUD: Each particle can be clicked individually
The state-of-the-art of uncomplicated evaluation: For fast single image viewing, each individual particle can be opened directly with a mouse click from the clearly arranged FRITSCH Cloud. The really important information for you about the morphology will be shown by the position of the data point in the Cloud. Without time-consuming search, you can immediately analyse, evaluate and delete individual selected particles. All available size and shape parameters are automatically displayed.
-
The FRITSCH Gallery: Everything at a glance
To get a quick overview of the typical particle shape of the analysed sample, view and evaluate all the images in a gallery which is integrated directly into the software for easy use. Individual particle images can be directly selected for single image analysis.
-
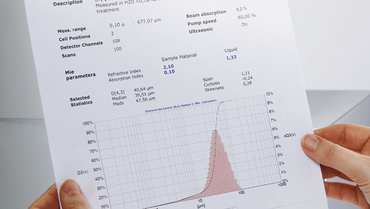
Freely configurable report generator
For automatically displaying the results clearly arranged on the monitor, either as a Cloud, as a cumulative curve, as a bar chart or in a table form. Or define a layout according to your sieve analysis. The displayed results are printed out as you set it up on the monitor.
-
Several measurements in a chart
Have several measurements displayed simultaneously in a chart and you will immediately see the differences between the respective samples. A direct visual evaluation – brilliantly simple, uniquely flexible.
-
Use ISS for your microscopic images
Simply load digital images from other imaging systems, e.g. from your microscope, into the evaluation software ISS of the ANALYSETTE 28 and access the full functionality and scope of evaluation options. Your advantage: a high-value image analysis software at no extra cost.

FRITSCH GmbH - Milling and Sizing
55743 Idar-Oberstein

FRITSCH GmbH - Milling and Sizing
55743 Idar-Oberstein