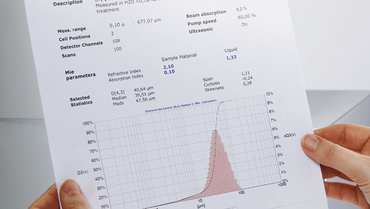
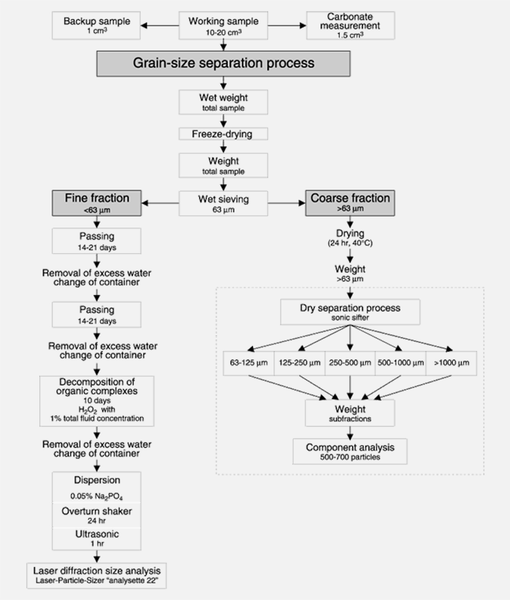
The development of below sea level deposits offshore the west coast of the Antarctic Peninsula was strongly influenced by the variation of the continental ice shield and the amount of ice in the ocean, which in turn influences the global climate. With core-depth drillings, these variations can be backtracked over periods of several millions of years. A significant aid is the particle size analysis. A substantial parameter which is determined during the examination of the sediments is the particle distribution of the obtained material. Here, at first, in an extensive procedure, the share of a particle size smaller than 63 μm is attained and prepared for the particle size determination.
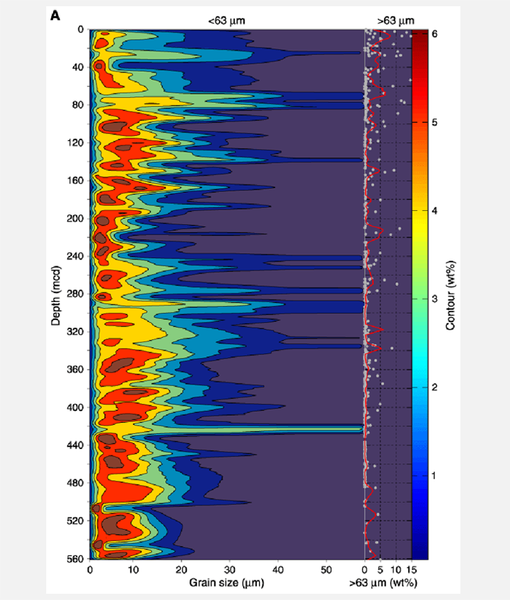
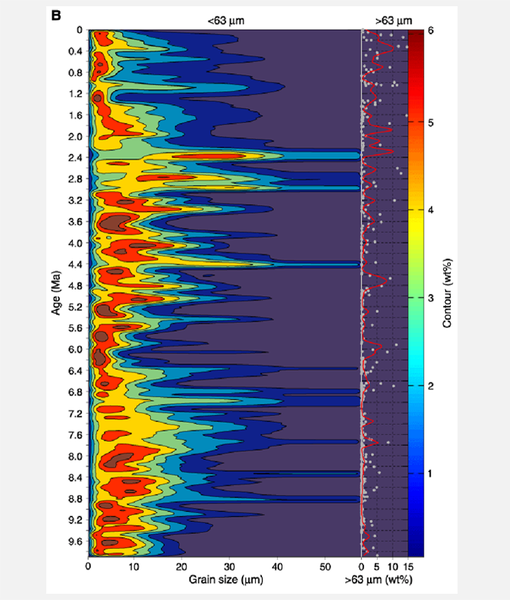
The obtained material was analysed with an ANALYSETTE 22 and the results evaluated in different manners. Exemplary shown here are here so called contour-plots of the fine share against the drilling depth respectively the age of the sediment, like it was received from magnetic examinations. The share larger than 63 µm is also in each case shown in a separate column.
Fig. 2: Contour-Plot of the particle size distribution. The particle size distribution for the sample material from different drilling depths was divided each into six size classes and colour coded.
From the measured distributions the so called distribution momentums can be obtained. The distribution momentums are statistical values, which in a brief, concise form characterize the distributions. Such a value for example is the standard deviation of the distribution, which is a dimension for its width, or the so called skewness, which reveals if a distribution is symmetrical (skewness= 0), features a greater amount of coarse area (skewness >0) or in the fine area (Skewness < 0).
In figure 3 are several of these statistical parameters applied, against the drilling depth as well as against the age of the sediment. However, here was the fine share smaller than 10 µm initially removed, since the special share between 10 and 63 µm delivers significant information in regards to deposit processes. The obtained results clearly change due to the suppression of the fine share smaller than 10 µm in comparison to the overall distribution.
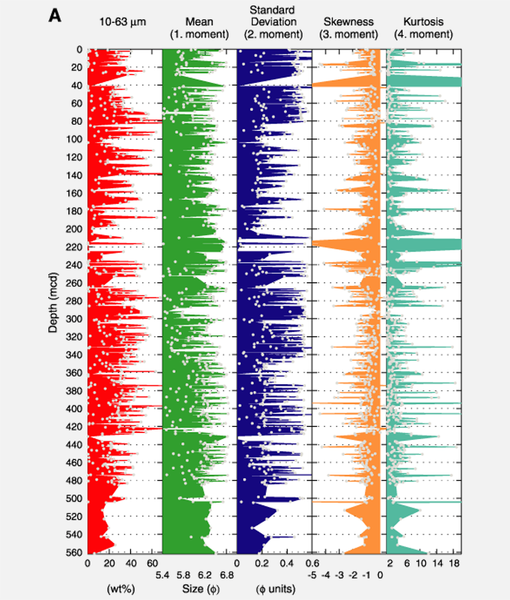
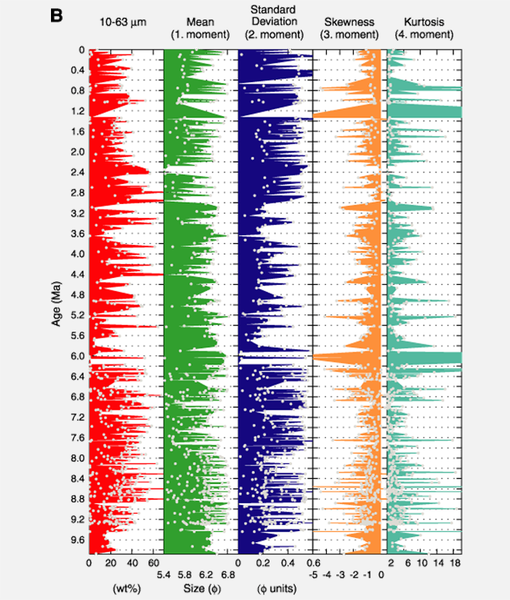
Fig. 3: Moments of the distribution applied against depth, respectively age. Considered here is only the share of the sediment with grain sizes in the range of 10-63 µm.
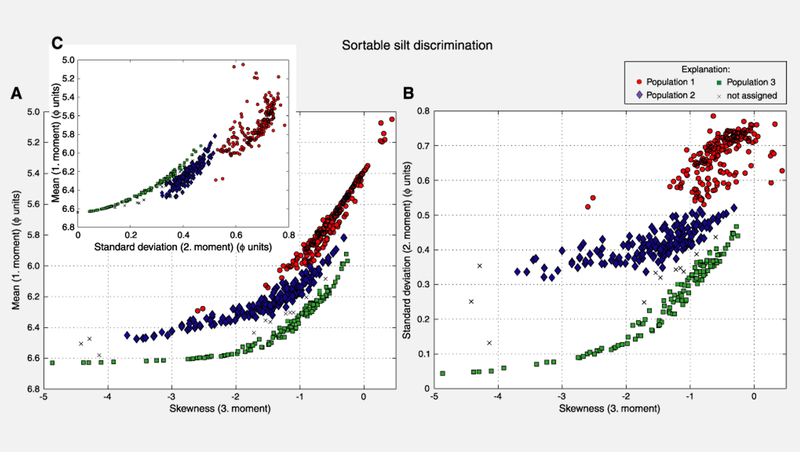
When now applying the so obtained skewness of all measured distributions for one, against the mean value of the particle size and secondly against the standard deviation of the distribution, so it is clearly recognizable in this illustration that there are three populations which can be matched to different depositing processes of the sediments, (Fig. 4).
Now viewing the individual populations, the in figure 5 shown diagrams are obtained. From these diagrams detailed conclusions can be drawn about the chronological order of the depositing processes which supplies important information about factors influencing these processes like for example the median temperature.
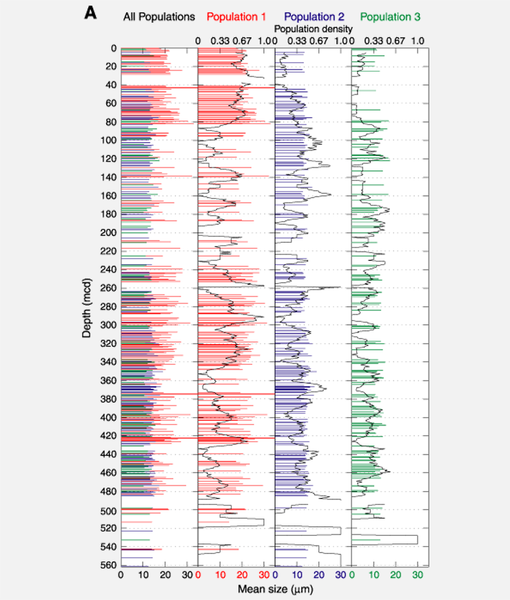
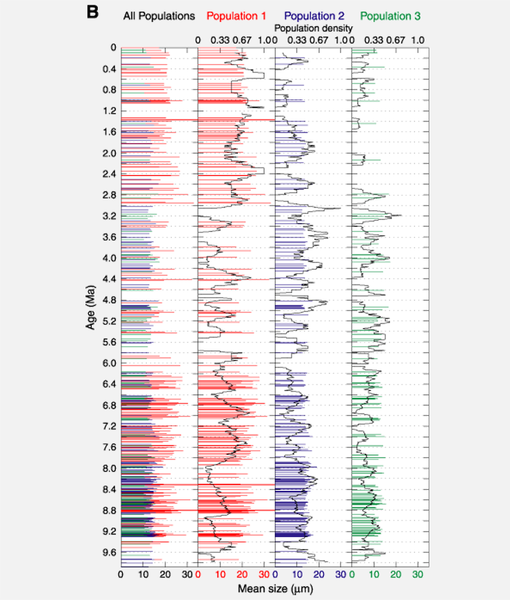
Fig. 5: Distribution of the single population applied over the drilling depth respectively the age of the sediments. Each population is colour coded and the amplitudes show the medium grain size. The black curves present respectively the share of the respective population in 10 m intervals.
-
Download the FRITSCH-report as PDF file
-
Sources and further literature
T. Moerz, und T.C.W. Wolf-Welling, 2001. Data report: Fine-fraction grain-size distribution data and their statistical treatment and relation to processes, Site 1095 (ODP Leg 178, western Antarctic Peninsula). In Barker, P.F., Camerlenghi, A., Acton, G.D., und Ramsay, A.T.S. (Eds.), Proc. ODP, Sci. Results, 178 [Online]. Available here: Publications

FRITSCH GmbH - Milling and Sizing
55743 Idar-Oberstein